27 Dec 2016
Hi all,
A month ago at the Connect event in New York Microsoft did some anouncements on SQL Server vNext and Azure Data Services.
It’s good to see the traction it’s getting!
I work with a lot of partners on implementing Microsoft stuff and the partners are very keen in getting the latest info on new capabilities.
Also they enlist in new online and in classroom courses on the new stuff. So let’s take a quick look:
- Azure Data Lake store and analytics went live in Novmeber, This is a no limits data lake with on-demand analytics that instantly scales to your needs. With petabyte size files and trillions of objects and parallel processing!
- R Server for Azure HD Insight for Largest R compatible parallel analytics ML library with terabyte-scale machine learning!
- SQL Server on Linux public preview is released. Check in out on a linux box!
- Moving selected Enterprise Edition capabilities to SQL Server Standard like in memory and Polybase.
And last but not least: connectivity to all top programming languages!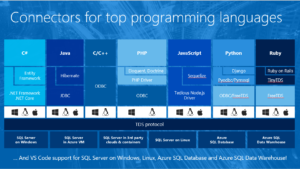
20 Dec 2016
Full screen
Most of this post will be in Dutch. Every year a list of 2000 songs is voted on by people from the Netherlands. This list is then broadcast by Radio 2 in the last days of the year. I decided to do a Power BI analysis on it and included all the lists from the start (1999). Also, I included an R-based forecast. If you want to get some insight into the musical taste in the Netherlands, go ahead and have fun!
De Top 2000. Fenomeen. Traditie. Zo’n ‘hoort-bij-de-tijd-van-het-jaar’ gevoel. Voor mij wel in ieder geval. Het is in ieder geval de beste afspiegeling van de muzieksmaak van Nederland die ik ken. Maar ja, wat heb je eraan als je geen vergelijking kunt maken met vorig jaar? 2000 nummers, dat is best veel om even te onthouden. En wie was ook alweer de grootste stijger vorig jaar? Wat is de oudste song in de lijst van jouw favoriete artiest? Welke song deed er het langst over om in de lijst te komen? Wat is er eigenlijk waar van de opmerking dat de lijst reageert op overlijden? Nu kun je het antwoord vinden op deze en vele andere vragen!
Ik heb namelijk alle Top 2000’s sinds het begin (1999) opgenomen in deze Power BI, als kerstcadeautje voor jou, lezer. Je kunt de analyse hieronder vinden. Ik heb drie views gemaakt: de eerste is gericht op artiesten zodat je meer te weten kunt komen over hoe jouw favoriete artiest het doet in de lijst. De tweede geeft inzicht in alles over een ‘versie’ van de Top 2000. Als bonus is er ook een forecast / voorspelling view (derde pagina). Hier kun je bekijken hoe op basis van de historie de positie van de artiesten / songs zich gaat ontwikkelen. Het mooiste is: alles is interactief.
Zo vinden we nu eindelijk het antwoord op de vraag of de lijst reageert op overlijden. Het antwoord is ja, kijk maar bij Michael Jackson (overleden 2009 en dat jaar zijn beste notering: #27) of Amy Winehouse (overleden 2011 en dat jaar haar beste notering: #72).
Doe er je voordeel mee. Ik vind het in ieder geval een mooie afspiegeling van de tijdsgeest. Ik wens jullie een fijne kerst!
02 Dec 2016
It was only recently that I discovered this – you can pass filters to Power BI reports by deep linking to it and adding a filter in the URL (also called query string). I am not even sure this is a feature, since it only seems to work for 'equals' and does not work on Dashboards in Power BI.
First of all, we need to understand deep linking in Power BI. Most artifacts in Power BI (for example reports and dashboards) have a their own URL. This means we can open them directly when we know the URL. The URL will have the following format:
https://[tenant].powerbi.com/groups/[workspace]/[artifact type]/[artifact id]/[optional part to be opened]
Thus, the URL may look like this:
https://app.powerbi.com/groups/me/reports/dc121d4b-9aad-4494-b1de-8037f53d8355/ReportSection3
This would open page ReportSection3 in report with id dc121d4b-9aad-4494-b1de-8037f53d8355 in my personal workspace in the tenant app.
If you know anything about web development, you know that you can pass things through the URL to the application this is normally done by adding a question mark to the end of the URL and specifying whatever you want to pass. Multiple items can be added by separating them out by ampersands, like this:
https://myurl.com/?firstname=Jeroen&Lastname=ter%20Heerdt
(notice the %20, which is a URL encoded space).
Combining these two things, you can pass parameters to Power BI reports if you have the report URL (simply open the report to get that). Once you have it, add the following:
?filter=[tablename]/[columnname] eq '[filter value]'
So, if I wanted to filter the activity column in my workitem table so it only shows items where the activity is blogging, I would add the following:
?filter=workitem/activity eq 'blogging'
(eq is short for equals here).
This needs, however, to be encoded for the URL. You can easily find tools online to do that for you, or if you know a little bit about what you are doing, you can do it by yourself. The addition above becomes:
?filter=workitem%252Factivity%20eq%20%27blogging%27
(/ becomes %252F, space becomes %20 and ' becomes %27)
This would open page ReportSection3 in report with id dc121d4b-9aad-4494-b1de-8037f53d8355 in my personal workspace in the tenant app with a filter set on the workitem table's activity column to be equal to blogging:
https://app.powerbi.com/groups/me/reports/dc121d4b-9aad-4494-b1de-8037f53d8355/ReportSection3?filter=workitem%252Factivity%20eq%20%27blogging%27
By the way, you would probably only want to use this is very specific scenario's. It is way better to look at Power BI Embedded to integrate Power BI in your applications. Note that Power BI Embedded is targeted at organizations providing software to others (hosted or not). It is not for internal applications.
04 Oct 2016
So here you are, creating your very own Power BI custom visual. You have read the documentation and ran the tutorial (https://github.com/Microsoft/PowerBI-visuals/blob/master/Readme.md and https://github.com/Microsoft/PowerBI-visuals-sampleBarChart). You feel proud because you are done creating your awesome looking 3d-piechart-barchart-mashup visual. Then it happens. You run: pbiviz start to view your visual and….BAM:

Ouch. Now, before you starting banging your head against the wall until it hurts, here is the solution:
Most probably you have (as good practice dictates) changed the class name of your visual from the default ‘Visual’ to something more interesting, such as MyAwesome3DpieChartBarChartMashupTheDutchDataDudeIsSoGoingToHateThisVisual.
Well, you forgot to change the visualClassName as specified in pbiviz.json so the code can actually find the entry point for your awesome visual. So, quick fix: open pbiviz.json and change the visualClassName property into your class name (which is hopefully not alike the one above). Save the file, re-run pbiviz start and done!
(I know this is a very newbie / getting started type of error, but it took me more than 5 minutes searching for it when I first encountered it. I figured it is worthwhile saving everyone’s time and log it for my own future reference ;))
 Dutch Data Dude