18 Apr 2018
Automating a data wrangling pipeline using chained Azure Functions. This post and its code was co-authored with Codeprincess.
Machine Learning is all about data… and algorithms. But first and most importantly it’s about data. And it’s not just any data, we need enough, high quality and (and in many cases) “cleaned” data. When we talk about cleaning data, we normally use the word ‘wrangling’. Wrangling is like washing clothes: your dirty data goes in and clean, neatly ironed and folded data comes out. We know from experience and research that data scientists spend 80% of their time wrangling (=cleaning) data – no wonder people call them “data janitors” from time to time!
Waste of talent
OK, your data scientists are spending most of their time on janitor and wrangler tasks. So what? Well, it turns out you normally do not need actual data scientists to do wrangling. You can leave that to others and have data scientists do what they do best: casting obscure mathematical spells to teach data tricks.
Mostly wrangling data is a sequential process of certain steps which need to be executed. In many cases this is executed by hand either using visual tools or by creating scripts. It all starts with data exploration to get an grasp of the data before taking steps to wrangle it.
Automating the data wrangling process
To speed up the wrangling process on the one hand and make it less painful on the other hand, we can automate the process. A great technology to use is Azure Functions. Azure Functions are stateless, serverless, short-running pieces of code. You can write them in many languages, we used C# and JavaScript in this situation. Each step on the wrangling process goes into its own Azure Function which then will chained to each other to form a pipeline where dirty data goes in and clean data goes out.
The scenario
Let’s start and have a look at a real-life scenario on how we set up the “make life of data scientists”-process easier. But first let’s look at the task which our process shall take care of.
A lovely customer of Microsoft Italy, wants to retrieve certain information from printed receipts like the total price, the sender and the receiver. Sounds easy enough, right? Well, think again. Receipts come in many different shapes and sizes. Some are taxi-like receipts or those little receipts you get from parking machines or handheld payment terminals. Other might meticulously designed hotel bills or even span multiple pages . In other words the receipts in question don’t have nearly anything in common. What they did have in common though is that they were saved as PDFs.
The approach
Our approach - as we sat down together in Milan during a week of hacking - was the following. We first collected a big bunch of keywords which indicate that around this word the information we are looking for could be found. For example the keyword “Totale” was always near the total amount - which is info we want to retrieve from the receipt. In this manner we went on and tried to collect as many keywords which match patterns like this.
By having the idea of “the keyword indicates where our info is probably located” we started looking through different services which can give us location info of text on a document. The search was quite short though, because we remembered that the Cognitive Services toolbox has something useful here: the Computer Vision OCR API. It returns OCRed text from a picture and gives additional info on the location of the text.
The location data of the text is structured in regions, which then have lines, which then have words. So we get not only location-identical text packed together - we might even get semantic info out of this if we assume that info which is close to each other just belongs to each other :)
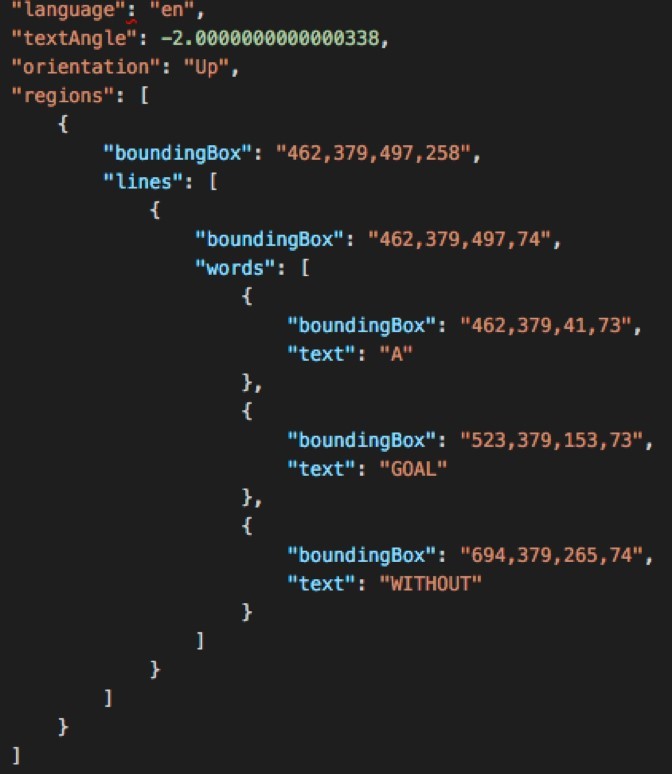
So our first step then was to convert our input PDF receipts into images, because our Computer Vision OCR API just takes images as an input. Those images were then scanned by the service for text and returned with its location metadata in JSON format (remember the region-line-word trio). See image above for a sample result of the OCR API.
For further analysis the JSON format was not that practical yet. That’s why we decided to flatten it. We cleaned out the detailed info about the regions and just packed all the text within one region together into a single string. The advantage of this was then to easily scan the strings for keywords. Imagine scanning the strings for the keyword “Totale” and if it fits have then a look for a number in that same string. The keyword “Totale” and if it fits have then a look for a number in that same string. The possibility is then quite high that we have found the total amount of the receipt. Victory!
That’s the basic process for preparing the data for the later following Machine Learning, with which the data can be analyzed further and the algorithm even learns from the structure of the documents and can provide a better detection than just heuristics.
Technically we developed the entire process with just two different cloud components:
- Azure Functions
- Azure Blob Storage
For each processing step we created an Azure Function to host and run the logic. And the blob storage was put in place to save the result of each logic step. To make things complete we kick off the pipeline with a blob storage - because all the receipt PDFs were saved in a blob storage. When a new PDF is uploaded to that blob storage the pipeline kicks into action and processes the PDF.
Final architecture
The little illustration shall give a good overview of what we have done here.
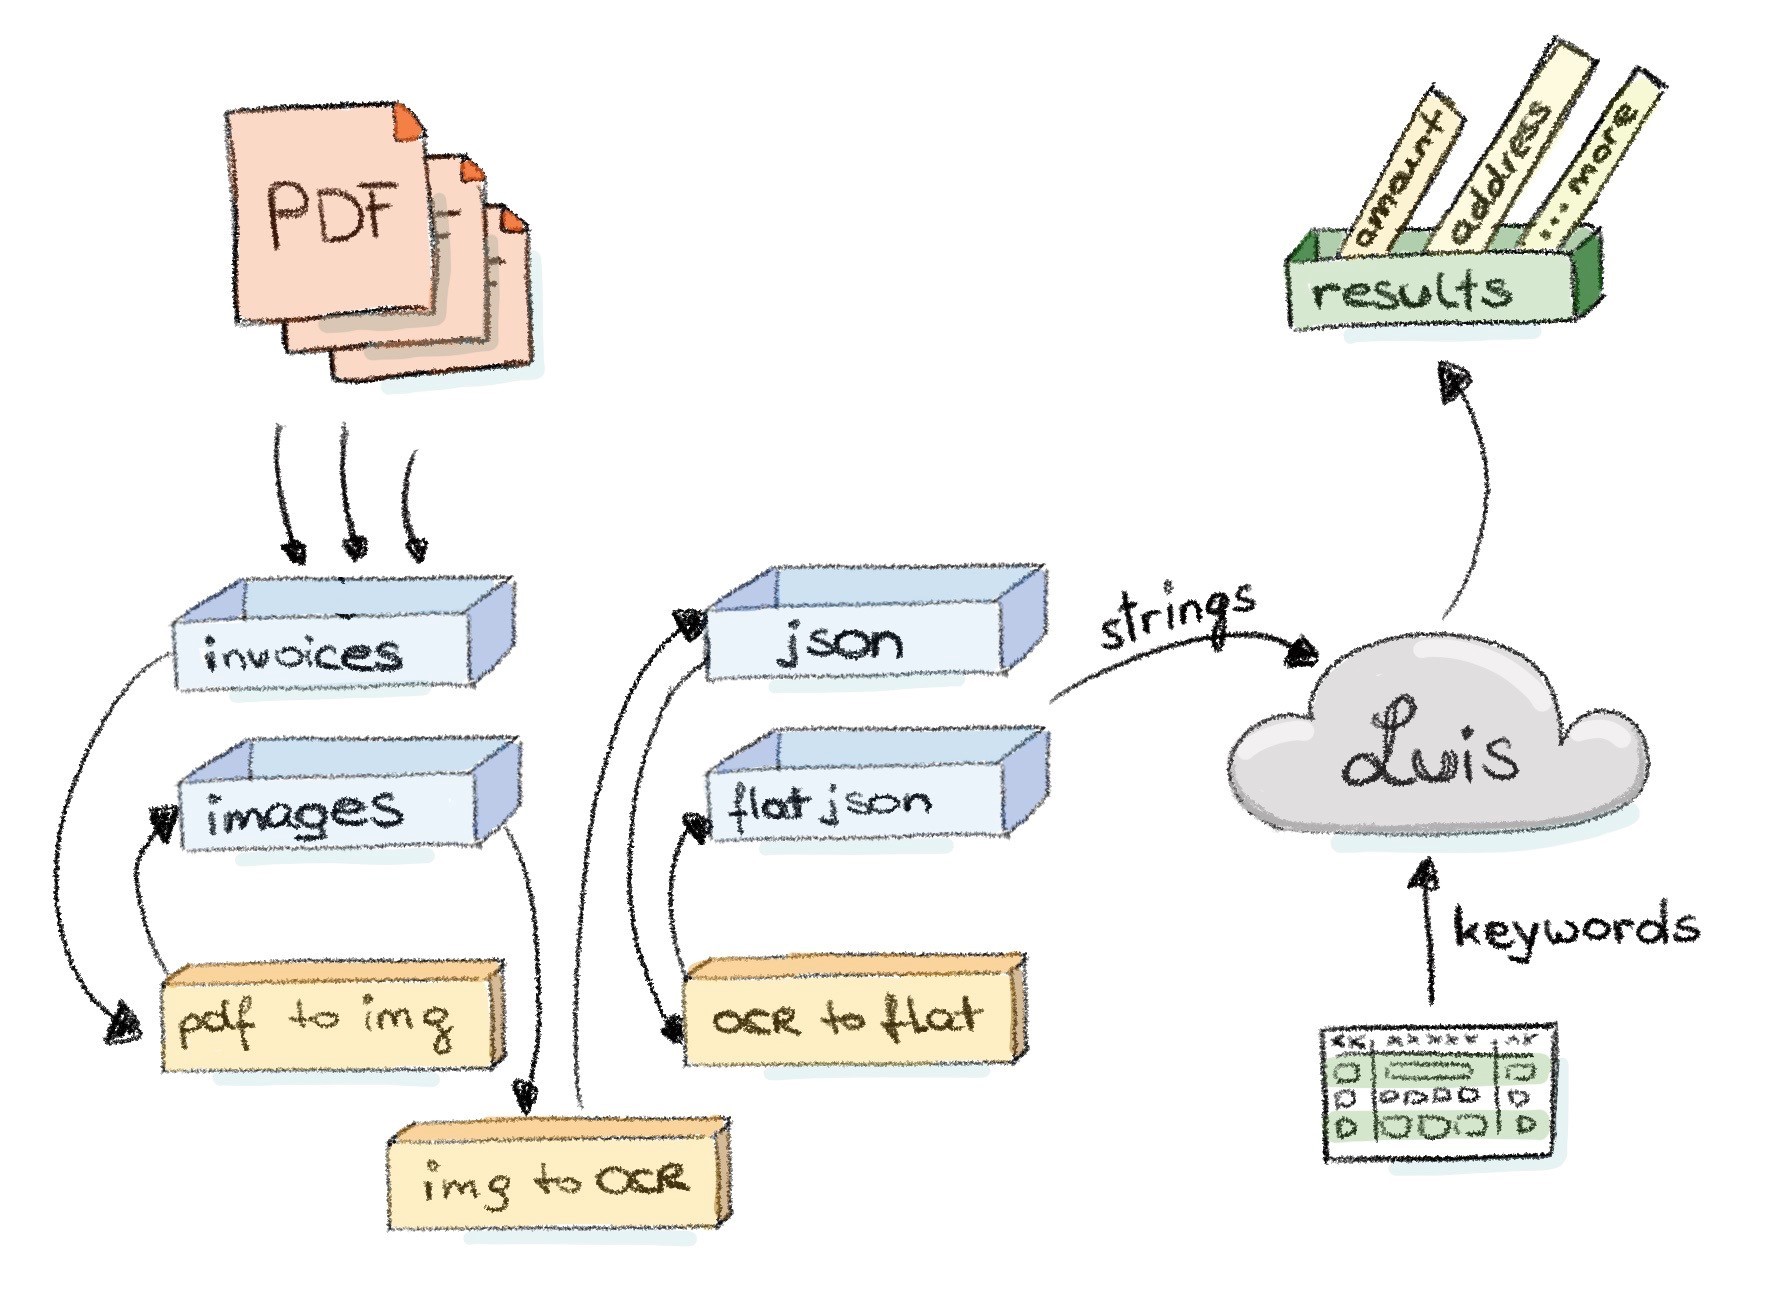
But to be on the safe side let’s look at the workflow in detail so that we don’t miss anything essential.
- Suddenly! A wild document appears!
- The document is saved in a blob storage, let’s say in folder “documents”.
- The first Azure Function (called PdfToPng, written in C#) starts running. It is blob storage triggered and converts the PDF to an PNG to save it in the blob storage folder “images”. This function depends on GhostScript to do the conversion. Have a look at this post for a step by step process on how to set-up the dependencies.
- The creation of this PNG file triggers the next Azure Function (called PngToOcr, written in C#). This function takes the image through the OCR service to save the JSON result in the blob storage folder “json”.
- By now it should be no surprise that another Azure Function is then triggered (called OcrToFlat, written in Node.js). It takes the JSON data and just creates a single string out of all the text within one detected OCR region to save it in the blob storage folder “flatjson”.
Done! And the incredible thing is - Azure Functions are running “serverless” which means we had no overhead work with setting them up. All we did is “just” put our code in them, define the trigger and where the output should go. We even mixed and matched programming languages, using whatever suited best for that step and/or was the preference of the developer. Our chain was set up! Another big advantage is that Functions run in parallel - or better to say “scale out” - which saves us a lot of time. The chain is triggered for each document individually which is put into the “documents” folder. So there are no actual waiting times for each document to get processed.
In the illustration we have one additional component which was not mentioned by now, which is LUIS. LUIS is the Language Understanding Service from the same toolbox we’re already using for the Computer Vision OCR API. But other than the OCR API, LUIS does not detect text from images, it detects intent and meaning from text. This is great for our data set because with LUIS we can find out what a flat string, which we are producing in the last step of our chain - is all about. So additionally to just plain keyword matching we can use this smart service to get higher hit rates on finding the info we want from our recipes.
The Code
All of the code is available on this Github repo.
You must admit - it’s a little bit awesome :) And technology just rocks :D What do you think?
06 Apr 2018
Power BI provides great time intelligence features to calculate Year-to-date (YTD), Month-to-date (MTD) and Quarter-to-date (QTD) totals. There is no such thing as Week-to-date (WTD) or Period-to-date (PTD) where period could be any arbitrary period definition (I used two-month periods in my example below). If you want those, you will have to create the calculations yourself. I was inspired by this excellent blog post and created an ultimate time-intelligence calculations Power BI file. I used Matt Massons excellent date dimension generation script to generate the date table for my example.
Download the full Power BI file here or get just the DAX formulas. Enjoy!
Basic Measures
Day Measures
- Total Amount for Last Day (Yesterday)
Amount_LastDay = CALCULATE([TotalAmount],PREVIOUSDAY('Date'[Date]))
- Total Amount for same Day last Year
Amount_SameDayLastYear = CALCULATE([TotalAmount],SAMEPERIODLASTYEAR('Date'[Date]))
- Variance of total Amount compared to Total Amount for Last Day
Amount_DOD_Variance = [TotalAmount]-[Amount_LastDay]
- Variance % of total Amount compared to Total Amount for Last Day
Amount_DOD_Variance% = DIVIDE([Amount_DOD_Variance],[Amount_LastDay])
- Variance of total Amount compared to Total Amount for same Day last Year
Amount_YOY_Variance = [TotalAmount]-[Amount_SameDayLastYear]
- Variance % of total Amount compared to Total Amount same Day last Year
Amount_YOY_Variance% = DIVIDE([Amount_YOY_Variance],[Amount_LastDay])
- Total Quantity for Last Day (Yesterday)
Quantity_LastDay = CALCULATE([TotalQuantity],PREVIOUSDAY('Date'[Date]))
- Total Quantity for same Day last Year
Quantity_SameDayLastYear = CALCULATE([TotalQuantity],SAMEPERIODLASTYEAR('Date'[Date]))
- Variance of total Quantity compared to Total Quantity for Last Day
Quantity_DOD_Variance = [TotalQuantity]-[Quantity_LastDay]
- Variance % of total Quantity compared to Total Quantity for Last Day
Quantity_DOD_Variance% = DIVIDE([Quantity_DOD_Variance],[Quantity_LastDay])
- Variance of total Quantity compared to total Quantity for same Day last Year
Quantity_YOY_Variance = [TotalQuantity]-[Quantity_SameDayLastYear]
- Variance % of total Quantity compared to total Quantity for same Day last Year
Quantity_YOY_Variance% = DIVIDE([Quantity_YOY_Variance],[Quantity_LastDay])
Week Measures
- Total Amount Week To Date
Amount_WTD = IF (
    HASONEVALUE ( 'Date'[Year] )
        && HASONEVALUE ('Date'[WeekNumber] ), CALCULATE(
        [TotalAmount],
        FILTER (
            ALL ( 'Date' ),
            'Date'[Year] = VALUES ( 'Date'[Year] )
                && 'Date'[WeekNumber] = VALUES ( 'Date'[WeekNumber] )
                && 'Date'[Date] <= MAX ( 'Date'[Date] )
        )
    ))
- Total Amount for Last Week
Amount_LastWeek = SUMX(
    FILTER(ALL('Date'),
        IF(SELECTEDVALUE('Date'[WeekNumber])=1,
            'Date'[WeekNumber]=CALCULATE(MAX('Date'[WeekNumber]), ALL('Date')) && 'Date'[Year]=FORMAT(VALUE(SELECTEDVALUE('Date'[Year]))-1,""),
            'Date'[WeekNumber]=SELECTEDVALUE('Date'[WeekNumber])-1 && 'Date'[Year]=FORMAT(VALUE(SELECTEDVALUE('Date'[Year])),""))
    ),
    [TotalAmount])
- Total Amount for same Week Last Year
Amount_SameWeekLastYear = IF (
    HASONEVALUE ( 'Date'[Year] )
        && HASONEVALUE ('Date'[WeekNumber] ), CALCULATE(
        SUM ( Sales[Amount] ),
        FILTER (
            ALL ( 'Date' ),
            'Date'[Year] = FORMAT(VALUES ( 'Date'[Year] )-1,"")
                && 'Date'[WeekNumber] = VALUES ( 'Date'[WeekNumber] )
                && 'Date'[Date] <= MAX ( 'Date'[Date] )
        )
    ))
- Variance of total Amount Week To Date compared to Total Amount for Last Week
Amount_WTD_WOW_Variance = [Amount_WTD]-[Amount_LastWeek]
- Variance % of total Amount Week To Date compared to Total Amount for Last Week
Amount_WTD_WOW_Variance% = DIVIDE([Amount_WTD_WOW_Variance],[Amount_LastWeek])
- Variance of total Amount Week to Date compared to Total Amount for same Week last Year
Amount_WTD_YOY_Variance = [Amount_WTD]-[Amount_SameWeekLastYear]
- Variance % of total Amount Week to Date compared to Total Amount for same Week last Year
Amount_WTD_YOY_Variance% = DIVIDE([Amount_WTD_YOY_Variance],[Amount_SameWeekLastYear])
- Total Quantity Week To Date
Quantity_WTD = IF (
    HASONEVALUE ( 'Date'[Year] )
        && HASONEVALUE ('Date'[WeekNumber] ),
    CALCULATE (
        [TotalQuantity],
        FILTER (
            ALL ( 'Date' ),
            'Date'[Year] = VALUES ( 'Date'[Year] )
                && 'Date'[WeekNumber] = VALUES ( 'Date'[WeekNumber] )
                && 'Date'[Date] <= MAX ( 'Date'[Date] )
        )
    ),
    BLANK ()
)
- Total Quantity for same Week Last Year
Quantity_SameWeekLastYear = IF (
    HASONEVALUE ( 'Date'[Year] )
        && HASONEVALUE ('Date'[WeekNumber] ), CALCULATE(
        SUM ( Sales[Quantity] ),
        FILTER (
            ALL ( 'Date' ),
            'Date'[Year] = FORMAT(VALUES ( 'Date'[Year] )-1,"")
                && 'Date'[WeekNumber] = VALUES ( 'Date'[WeekNumber] )
                && 'Date'[Date] <= MAX ( 'Date'[Date] )
        )
    ))
- Total Quantity for Last Week
Quantity_LastWeek = SUMX(
    FILTER(ALL('Date'),
        IF(SELECTEDVALUE('Date'[WeekNumber])=1,
            'Date'[WeekNumber]=CALCULATE(MAX('Date'[WeekNumber]), ALL('Date')) && 'Date'[Year]=FORMAT(VALUE(SELECTEDVALUE('Date'[Year]))-1,""),
            'Date'[WeekNumber]=SELECTEDVALUE('Date'[WeekNumber])-1 && 'Date'[Year]=FORMAT(VALUE(SELECTEDVALUE('Date'[Year])),""))
    ),
    [TotalQuantity])
- Variance of total Quantity Week To Date compared to Total Quantity for Last Week
Quantity_WTD_WOW_Variance = [Quantity_WTD]-[Quantity_LastWeek]
- Variance % of total Quantity Week To Date compared to Total Quantity for Last Week
Quantity_WTD_WOW_Variance% = DIVIDE([Quantity_WTD_WOW_Variance],[Quantity_LastWeek])
- Variance of total Quantity Week to Date compared to Total Quantity for same Week last Year
Quantity_WTD_YOY_Variance = [Quantity_WTD]-[Quantity_SameWeekLastYear]
- Variance % of total Quantity Week to Date compared to Total Quantity for same Week last Year
Quantity_WTD_YOY_Variance% = DIVIDE([Quantity_WTD_YOY_Variance],[Quantity_SameWeekLastYear])
Month Measures
- Total Amount Month To Date
Amount_MTD = TOTALMTD([TotalAmount],'Date'[Date])
- Total Amount for same Month Last Year
Amount_SameMonthLastYear = CALCULATE([Amount_MTD],SAMEPERIODLASTYEAR('Date'[Date]))
- Total Amount for Last Month
Amount_LastMonth = CALCULATE([TotalAmount],PREVIOUSMONTH('Date'[Date]))
- Variance of total Amount Month To Date compared to Total Amount for Last Month
Amount_MTD_MOM_Variance = [Amount_MTD]-[Amount_LastMonth]
- Variance % of total Amount Month To Date compared to Total Amount for Last Month
Amount_MTD_MOM_Variance% = DIVIDE([Amount_MTD_MOM_Variance],[Amount_LastMonth])
- Variance of total Amount Month to Date compared to Total Amount for same Month last Year
Amount_MTD_YOY_Variance = [Amount_MTD]-[Amount_SameMonthLastYear]
- Variance % of total Amount Month to Date compared to Total Amount for same Month last Year
Amount_MTD_YOY_Variance% = DIVIDE([Amount_MTD_YOY_Variance],[Amount_SameMonthLastYear])
- Total Quantity Month To Date
Quantity_MTD = TOTALMTD([TotalQuantity],'Date'[Date])
- Total Quantity for same Month Last Year
Quantity_SameMonthLastYear = CALCULATE([Quantity_MTD],SAMEPERIODLASTYEAR('Date'[Date]))
- Total Quantity for Last Month
Quantity_LastMonth = CALCULATE([TotalQuantity],PREVIOUSMONTH('Date'[Date]))
- Variance of total Quantity Month To Date compared to Total Quantity for Last Month
Quantity_MTD_MOM_Variance = [Quantity_MTD]-[Quantity_LastMonth]
- Variance % of total Quantity Month To Date compared to Total Quantity for Last Month
Quantity_MTD_MOM_Variance% = DIVIDE([Quantity_MTD_MOM_Variance],[Quantity_LastMonth])
- Variance of total Quantity Month to Date compared to Total Quantity for same Month last Year
Quantity_MTD_YOY_Variance = [Quantity_MTD]-[Quantity_SameMonthLastYear]
- Variance % of total Quantity Month to Date compared to Total Quantity for same Month last Year
Quantity_MTD_YOY_Variance% = DIVIDE([Quantity_MTD_YOY_Variance],[Quantity_SameMonthLastYear])
Period Measures
- Total Amount Period To Date
Amount_PTD = IF (
    HASONEVALUE ( 'Date'[Year] )
        && HASONEVALUE ('Date'[TwoMonthPeriod] ),
    CALCULATE (
        [TotalAmount],
        FILTER (
            ALL ( 'Date' ),
            'Date'[Year] = VALUES ( 'Date'[Year] )
                && 'Date'[TwoMonthPeriod] = VALUES ( 'Date'[TwoMonthPeriod] )
                && 'Date'[Date] <= MAX ( 'Date'[Date] )
        )
    ),
    BLANK ()
)
- Total Amount for same Period Last Year
Amount_SamePeriodLastYear = CALCULATE([Amount_PTD],SAMEPERIODLASTYEAR('Date'[Date]))
- Total Amount for Last Period
Amount_LastPeriod = CALCULATE([TotalAmount],DATEADD('Date'[Date],-2,MONTH))
- Variance of total Amount Period To Date compared to Total Amount for Last Period
Amount_PTD_POP_Variance = [Amount_PTD]-[Amount_LastPeriod]
- Variance % of total Amount Period To Date compared to Total Amount for Last Period
Amount_PTD_POP_Variance% = DIVIDE([Amount_PTD_POP_Variance],[Amount_LastPeriod])
- Variance of total Amount Period to Date compared to Total Amount for same Period last Year
Amount_PTD_YOY_Variance = [Amount_PTD]-[Amount_SamePeriodLastYear]
- Variance % of total Amount Period to Date compared to Total Amount for same Period last Year
Amount_PTD_YOY_Variance% = DIVIDE([Amount_PTD_YOY_Variance],[Amount_SamePeriodLastYear])
- Total Quantity Period To Date
Quantity_PTD = IF (
    HASONEVALUE ( 'Date'[Year] )
        && HASONEVALUE ('Date'[TwoMonthPeriod] ),
    CALCULATE (
        [TotalQuantity],
        FILTER (
            ALL ( 'Date' ),
            'Date'[Year] = VALUES ( 'Date'[Year] )
                && 'Date'[TwoMonthPeriod] = VALUES ( 'Date'[TwoMonthPeriod] )
                && 'Date'[Date] <= MAX ( 'Date'[Date] )
        )
    ),
    BLANK ()
)
- Total Quantity for same Period Last Year
Quantity_SamePeriodLastYear = CALCULATE([Quantity_PTD],SAMEPERIODLASTYEAR('Date'[Date]))
- Total Quantity for Last Period
Quantity_LastPeriod = CALCULATE([TotalQuantity],DATEADD('Date'[Date],-2,MONTH))
- Variance of total Quantity Period To Date compared to Total Quantity for Last Period
Quantity_PTD_POP_Variance = [Quantity_PTD]-[Quantity_LastPeriod]
- Variance % of total Quantity Period To Date compared to Total Quantity for Last Period
Quantity_PTD_POP_Variance% = DIVIDE([Quantity_PTD_POP_Variance],[Quantity_LastPeriod])
- Variance % of total Quantity Period to Date compared to Total Quantity for same Period last Year
Quantity_PTD_YOY_Variance = [Quantity_PTD]-[Quantity_SamePeriodLastYear]
- Variance of total Quantity Period to Date compared to Total Quantity for same Period last Year
Quantity_PTD_YOY_Variance% = DIVIDE([Quantity_PTD_YOY_Variance],[Quantity_SamePeriodLastYear])
Quarter Measures
- Total Amount Quarter To Date
Amount_QTD = TOTALQTD([TotalAmount],'Date'[Date])
- Total Amount for same Quarter Last Year
Amount_SameQuarterLastYear = CALCULATE([Amount_QTD],SAMEPERIODLASTYEAR('Date'[Date]))
- Total Amount for Last Quarter
Amount_LastQuarter = CALCULATE([TotalAmount],PREVIOUSQUARTER('Date'[Date]))
- Variance of total Amount Quarter To Date compared to Total Amount for Last Quarter
Amount_QTD_QOQ_Variance = [Amount_QTD]-[Amount_LastQuarter]
- Variance % of total Amount Quarter To Date compared to Total Amount for Last Quarter
Amount_QTD_QOQ_Variance% = DIVIDE([Amount_QTD_QOQ_Variance],[Amount_LastQuarter])
- Variance of total Amount Quarter to Date compared to Total Amount for same Quarter last Year
Amount_QTD_YOY_Variance = [Amount_QTD]-[Amount_SameQuarterLastYear]
- Variance % of total Amount Quarter to Date compared to Total Amount for same Quarter last Year
Amount_QTD_YOY_Variance% = DIVIDE([Amount_QTD_YOY_Variance],[Amount_SameQuarterLastYear])
- Total Quantity Quarter To Date
Quantity_QTD = TOTALQTD([TotalQuantity],'Date'[Date])
- Total Quantity for same Quarter Last Year
Quantity_SameQuarterLastYear = CALCULATE([Quantity_QTD],SAMEPERIODLASTYEAR('Date'[Date]))
- Total Quantity for Last Quarter
Quantity_LastQuarter = CALCULATE([TotalQuantity],PREVIOUSQUARTER('Date'[Date]))
- Variance of total Quantity Quarter To Date compared to Total Quantity for Last Quarter
Quantity_QTD_QOQ_Variance = [Quantity_QTD]-[Quantity_LastQuarter]
- Variance % of total Quantity Quarter To Date compared to Total Quantity for Last Quarter
Quantity_QTD_QOQ_Variance% = DIVIDE([Quantity_QTD_QOQ_Variance],[Quantity_LastQuarter])
- Variance of total Quantity Quarter To Date compared to Total Quantity or same Quarter last Year
Quantity_QTD_YOY_Variance = [Quantity_QTD]-[Quantity_SameQuarterLastYear]
- Variance % of total Quantity Quarter To Date compared to Total Quantity for same Quarter last Year
Quantity_QTD_YOY_Variance% = DIVIDE([Quantity_QTD_YOY_Variance],[Quantity_SameQuarterLastYear])
Year Measures
- Total Amount Year To Date
Amount_YTD = TOTALYTD([TotalAmount],'Date'[Date])
- Total Amount for Last Year
Amount_LastYear = CALCULATE([Amount_YTD],PREVIOUSYEAR('Date'[Date]))
- Variance of total Amount Year To Date compared to Total Amount for Last Year
Amount_YTD_YOY_Variance = [Amount_YTD]-[Amount_LastYear]
- Variance% of total Amount Year To Date compared to Total Amount for Last Year
Amount_YTD_YOY_Variance% = DIVIDE([Amount_YTD_YOY_Variance],[Amount_LastYear])
- Total Quantity Year To Date
Quantity_YTD = TOTALYTD([TotalQuantity],'Date'[Date])
- Total Quantity for Last Year
Quantity_LastYear = CALCULATE([TotalQuantity],PREVIOUSYEAR('Date'[Date]))
- Variance of total Quantity Year To Date compared to Total Quantity for Last Year
Quantity_YTD_YOY_Variance = -[Quantity_YTD]-[Quantity_LastYear]
- Variance% of total Quantity Year To Date compared to Total Quantity for Last Year
Quantity_YTD_YOY_Variance% = DIVIDE([Quantity_YTD_YOY_Variance],[Quantity_LastYear])
28 Dec 2017
I have written before on the subject of using Power BIs mapping capabilities (see the post on ArcGIS) and using the maps with Dutch geographical data (see using Dutch postal codes in Power Map). However, I have never did a more thorough exploration of the mapping capabilities of Power BI using Dutch data. Until now! (Niels, thanks for requesting me to do this).
Please see the Power BI report below - the first tab shows the dataset I used. The other tabs show the way(s) to work with the various maps to plot Dutch data. Unfortunately the ArcGIS visual is not supported in the mode I use here - please download the original Power BI desktop file below. Enjoy!
Download Power BI Desktop file
 Dutch Data Dude
 DUTCH DATA DUDE
FAREWELL TOUR
DUTCH DATA DUDE
FAREWELL TOUR
 A CHANGE IS GONNA COME
Na bijna 10 jaar waag ik de grote stap. Ik verhuis naar Amerika en ga voor Microsoft in Seattle aan de slag. Daarmee komt er een einde aan mijn werk als Dutch Data Dude in Nederland (en daarbuiten). Werk dat ik met veel passie heb gedaan en heb kunnen doen dankzij en met jullie. Om dit deel gepast af te sluiten doe ik een FAREWELL TOUR: ik klim nog een laatste keer op het podium. Bij jullie, voor jullie. Want jullie hebben mij in staat gesteld te worden wie ik wilde zijn: het geluid van Microsoft rondom data en Artificial Intelligence. Dutch Data Dude signs off.
A CHANGE IS GONNA COME
Na bijna 10 jaar waag ik de grote stap. Ik verhuis naar Amerika en ga voor Microsoft in Seattle aan de slag. Daarmee komt er een einde aan mijn werk als Dutch Data Dude in Nederland (en daarbuiten). Werk dat ik met veel passie heb gedaan en heb kunnen doen dankzij en met jullie. Om dit deel gepast af te sluiten doe ik een FAREWELL TOUR: ik klim nog een laatste keer op het podium. Bij jullie, voor jullie. Want jullie hebben mij in staat gesteld te worden wie ik wilde zijn: het geluid van Microsoft rondom data en Artificial Intelligence. Dutch Data Dude signs off.
 DE TOUR
Tijdens de FAREWELL TOUR geef ik in korte tijd een flink aantal presentaties.
Dit organiseer ik samen met partners in October / November 2018. Het onderwerp van de presentaties is Business Intelligence, Big Data, Machine Learning of Artificial Intelligence. Soms staat mijn presentatie op zich, soms is het onderdeel van een groter geheel. Alles in samenspraak met de organiserende partner. Ik hoop je te mogen begroeten tijdens de FAREWELL TOUR.
DE TOUR
Tijdens de FAREWELL TOUR geef ik in korte tijd een flink aantal presentaties.
Dit organiseer ik samen met partners in October / November 2018. Het onderwerp van de presentaties is Business Intelligence, Big Data, Machine Learning of Artificial Intelligence. Soms staat mijn presentatie op zich, soms is het onderdeel van een groter geheel. Alles in samenspraak met de organiserende partner. Ik hoop je te mogen begroeten tijdens de FAREWELL TOUR.