20 Aug 2013
This is the third post in my series about multilingual SSRS reports. If you missed the introduction, you can find it here.
In this post we will talk about the second implementation scenario, which changes the RDL after creating it. The diagram below helps to understand this:

This means that developing the report is independent of making it available in multiple languages.
This means there is no impact on the process of creating a report, where with the first scenario (custom assembly) there was an impact (and a rather big one!).
The downside of this solution however is that there will be a separate process manipulating the RDL after it has been developed. This has a downside however: if the RDL language schema changes (and it does just about every new release of SQL) you will have to check if your code still works.
Now, the process that changes the RDL could do two things: 1) change the original RDL and add localization that will actually localize the report at run time or 2) change the original RDL and make a copy of it for every language (essentially you get the same report multiple times).
The first option here is just an automated version of scenario number 1 (the custom assembly) which we discussed earlier. It however eliminates the biggest issue with scenario 1: the fact that it is a manual process and has to be repeated for every label. However, what this option doesn’t do is allow you to translate parameter prompts, which option 2 does. Downside of option 2 however is that multiple copies of the report get created (one for each language). Creating multiple copies of the report (one for each language) would have no impact on rendering the report and may be a good choice if you want to manage each language separately. You will need to decide for yourself what you want to do, the basic architecture of this scenario stay the same.
In this post we will deal with the latter option (option 2).
I envision the process that changes the RDL as just a process that gets executed periodically. The process reads the RDL and translates any text it finds again using the translation table, resource file or whatever solution you picked for storing translations.
Implementing the process is out of scope for this blog because it is a matter of reading an XML file (RDL is XML structured) changing some items and writing it to disk. Any .NET developer could do it, for example using XPath.
The trick of course is knowing what to find in the RDL and what to change.
The simplified structure of RDL (SQL 2012) is the following (I stripped away all that is not related to localization):
<?xml version="1.0" encoding="utf-8"?>
<Report>
    <DataSources/>
    <DataSets>
        <DataSet/>
    </DataSets>
    <ReportSections>
        <ReportSection>
            <Body>
                <ReportItems>
                    <TextBox/>
                    <Tablix/>
                    <Chart/>
                </ReportItems>
            </Body>
            <Page>
                <PageHeader>
                    <ReportItems>
                        <TextBox/>
                    </ReportItems>
                </PageHeader>
                <PageFooter>
                    <ReportItems>
                        <TextBox/>
                    </ReportItems>
                </PageFooter>
            </Page>
        </ReportSection>
    </ReportSections>
    <ReportParameters>
        <ReportParameter/>
    </ReportParameters>
    <Language/>
</Report>
As you can see, there a just a couple of items we need to look for when scanning the RDL:
- Report.DataSets.DataSet
DataSets define the queries to the source systems. If we want to localize result sets we need to manipulate the query here.
-
Report.ReportSections.ReportSection.Body.ReportItems / Report. ReportSections.ReportSection.Page.PageHeader.ReportItems / Report. ReportSections.ReportSection.Page.PageFooter.ReportItems
ReportItems can be TextBox, Chart, Tablix, which will be discussed in more detail later.
- Report.ReportParameters.ReportParameter
Parameter prompts can be localized here.
Localizing a DataSet
A dataset defines the <CommandText> which essentially is the query to the source system. When changing the RDL one can easily add a where-clause to the query indicating the language to render:
Where translationtable.language='en-us'.
What you will be looking for is Report.DataSets.DataSet.CommandText to do this.
Localizing ReportItems
ReportItems can be TextBoxes, Charts, and Tablixes each of which carry one or more labels that need localization.
The structure of a TextBox looks like this:
<TextBox>
    <Paragraphs>
        <TextRuns>
            <TextRun>
                <Value/>
            </TextRun>
        </TextRuns>
    </Paragraphs>
</TextBox>
You will be wanting to localize what is inside <Value></Value> tag.
For Tablixes you will also be looking for the <Value></Value> tags inside TextRuns on Cells, which are just TextBoxes. Here is the basic structure of a Tablix:
<Tablix>
    <TablixColumns/>
    <TablixRows>
        <TablixRow>
            <Height/>
            <TablixCells>
                <TablixCell>
                    <CellContents>
                        <TextBox/>
                    </CellContents>
                </TablixCell>
            </TablixCells>
        </TablixRow>
    </TablixRows>
</Tablix>
You will want to change what is inside the <Value></Value> tag of each TextBox. The TextBox here has the same structure as above.
Finally, Charts are a bit different, their basic structure is like this:
<Chart>
    <ChartCategoryHierarchy/>
    <ChartSeriesHierarchy>
        <ChartMembers>
            <ChartMember>
               <Label/>
            </ChartMember>
        </ChartMembers>
    </ChartSeriesHierarchy>
    <ChartData>
        <ChartSeriesCollection>
            <ChartSeries Name=""/>
        </ChartSeriesCollection>
    </ChartData>
    <ChartAreas>
        <ChartArea>
            <ChartCategoryAxes>
                <ChartAxis>
                    <ChartAxisTitle>
                        <Caption/>
                    </ChartAxisTitle>
                </ChartAxis>
            </ChartCategoryAxes>
            <ChartValueAxes>
                <ChartAxis>
                    <ChartAxisTitle>
                        <Caption/>
                    </ChartAxisTitle>
                </ChartAxis>
            </ChartValueAxes>
        </ChartArea>
     </ChartAreas>
     <ChartLegends>
        <ChartLegend>
            <ChartLegendTitle>
                <Caption/>
            </ChartLegendTitle>
        </ChartLegend>
     </ChartLegends>
     <ChartNoDataMessage>
         <Caption/>
     </ChartNoDataMessage>
</Chart>
You can localize the following items on charts:
- Series name: Chart.Chartdata.ChartSeriesCollection.ChartSeries.Name
- Axis Title: Chart.ChartAreas.ChartArea.ChartCategoryAxes.ChartAxis.ChartAxisTitle.Caption and ChartAreas.ChartArea.ChartValueAxes.ChartAxis.ChartAxisTitle.Caption
- Chart legend title: Chart.ChartLegens.ChartLegend.ChartLegendTitle.Caption
- No data message: Chart.ChartNodataMessage.Caption
Localizing Report Parameters
ReportParameters define data types, default values, valid values and also the prompts. The last one you will be wanting to localize.
The basic structure of the ReportParameter definition is:
<ReportParameter>
   <DataType/>
   <DefaultValue/>
        <Prompt/>
   <ValidValues/>
   <MultiValue/>
</ReportParameter>
You will be looking for the ReportParameter.Prompt tag.
That concludes our overview of changing the RDL to implement localization. I agree it is not the most elegant solution as it increases dependency and complexity in your environment, however it is fairly simple to implement and provides a complete localization opportunity, from datasets to report items and even parameter prompts.
Stay tuned for the next implementation scenario!
13 Aug 2013
I have been getting some feedback during the past three weeks (during which I was on vacation) on my post about macros, where I claim that macros are dead. Apart from the odd hateful mail from a hardcore macro lover, the main feedback was: I get what you say but right now I am stuck with all these Excel files with macros. I do not know where to begin, can you help?
To those of you I say: do not despair. If you have a lot of Excel sheets with macros (and lets face it, Excel files are where most macros are found!) and you have Office 2013 the solution is just around the corner.
Open Excel, click File, Options, Add-ins. Then at the bottom where it says ‘Manage’, select COM add-ins and click ‘Go’. Then enable ‘Inquire’ and click OK.
This add-in enables you to investigate an Excel sheets for lots of things, such as hidden sheets, very hidden sheets (I did not even know that was possible), formula’s and macros. Also, you can check out dependencies between sheets and sources and compare two sheets. When comparing two sheets you can even spot the difference between macros down to a single line of code!
This solution is also available as server solution for some more automatic scanning of your Excel workbooks. It is called Audit and Management Control Server 2013.
More info here:
Inquire add-in for Excel: http://office.microsoft.com/en-us/excel-help/what-you-can-do-with-spreadsheet-inquire-HA102835926.aspx
Audit and Control management server 2013: http://technet.microsoft.com/en-us/library/jj631654.aspx
Get those spreadsheets under control!
16 Jul 2013
Macros are dead. Or soon will be. Think about it: in Office 2003 when you opened a file with a macro the macro was automatically enabled and ready to run.
Then with the arrival of Office 2007 things turned bad for macros and macro creators. Macros were treated as security risk:
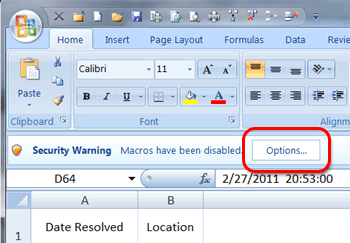
As a user you explicitly have to choose to run the macro.
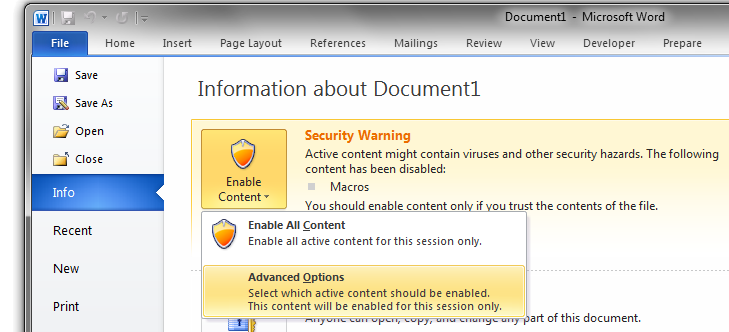
Then, Office 2010 came along and the security warnings became bigger (and I believe you had to click twice to enable them instead of once). The same goes for Office 2013.
Also, along the way this warning was introduced:
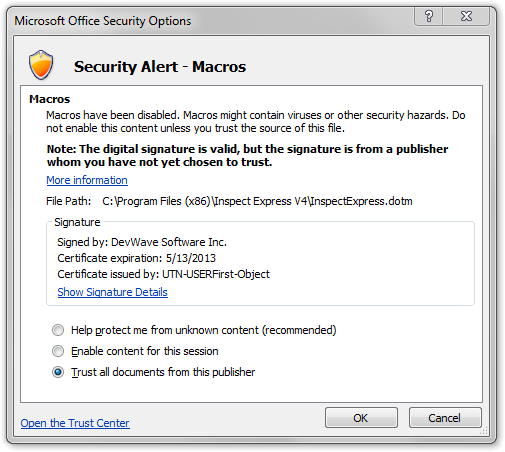
Look at those first lines: ‘might contain viruses or other security hazards’. That kind of says it all: macros are dead. With the extra focus on security this makes sense. Also, eliminiating macros helps you to deal with spaghetti code lurking around in your documents. I feel you should not be creating any new files with macros and files with macros should be checked and migrated to something “better”.
Do not use macros if you want your document to be opened without security warnings. Also, know that macros do not run on all mobile devices (For example, Office RT does not run macros).
So, what do you need to do if you need to program in your Office documents? Well, if you’re using Office 2007 or 2010 you should be developing a VSTO (Visual Studio Tools for Office) add-in, which is a piece of managed code built using Visual Studio, which is essentially an add-in with the big difference that the code is not sitting in the document itself, but outside of it. If done well, this code can be centrally managed and be treated as what it actually is: application code.
See: http://msdn.microsoft.com/en-us/magazine/cc163292.aspx.
Now, for Office 2013 you should be building apps: http://msdn.microsoft.com/en-us/office/apps/fp160950.aspx.
09 Jul 2013
Yesterday Microsoft announced Power BI for Office 365: a self-service Business Intelligence solution delivered through Excel and Office 365. Power BI ties together the various bits and pieces we already had (Power View, PowerPivot, GeoFlow, Data Explorer) and also introduces some exciting new functionality. In this post I will introduce you to Power BI and discuss the various capabilities. Future blog posts will deal with the components more in-depth.
(By the way, do not let the tag “for Office 365” set you back; Geoflow Power Map and Data Explorer Power Query are available as add-in for Excel regardless of whether you use Office 365 or not).
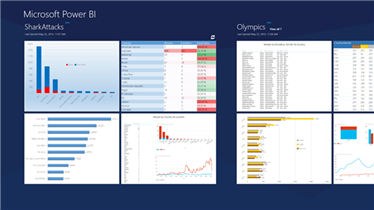
Power BI
The image below shows the Power BI platform. I have broken it down in two segments: Excel and Office 365.
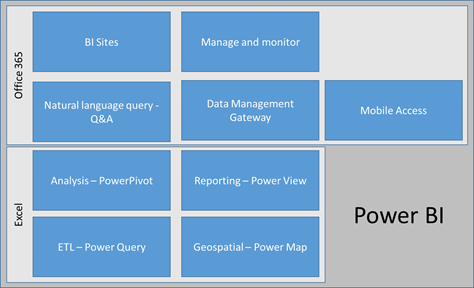
With Power BI we take the next step to making Excel a true BI tool. BI developers used to smile when I talked about Excel and told me Excel helped end users create non-transparent, spaghetti like BI solutions. I have to admit, that is true. Now with Power BI anything you do with data in Excel, from loading and cleansing using Power Query, modelling and enriching it using PowerPivot and finally displaying using Power View and Power Map is structured and traced. No more page long formulas. No more copy-paste, hidden sheets, linked formulas and other nightmares for us BI folk.
ETL – Power Query
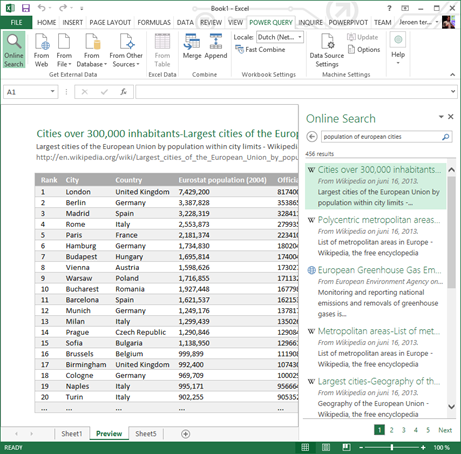
Previously named Data Explorer, Power Query is our self-service ETL tool in Excel. Power Query can connect to just about any data source you throw at it and it enables you to load data, cleanse it and then use it in your Power Pivot model. It even includes a natural language search function that helps you find information in your organization or on the web if you do not actually know where the info could be at. Imagine have loaded something from your corporate data warehouse and then adding relevant external information (such as weather or population info) from the web without having to leave Excel! Once you have loaded data you can add and drop columns, change data types, split columns, combine tables, filter data, remove duplicates, etc. Power Query not only connects to “standard” databases and files, but also includes a connection to Facebook, Hadoop (HDFS and Azure HDInsight), SharePoint and any OData Feed. All steps you do in Power Query are stored in a script so it is clear where data came from, what happened to it along the way and where it got displayed. See my screenshot below: I did a web search for ‘population of European cities’ and clicked on a Wikipedia page to get the data in Excel.
Analysis – PowerPivot
PowerPivot has been out for a while and has gotten quite some attention. PowerPivot allows you to do data modelling with massive amounts of data in Excel. With massive, I mean huge. I keep repeating this as long as I keep meeting people who still think that Excel cannot handle 5 million records (that happened to me yesterday). With PowerPivot it is easy to load data from various sources, link them together (essentially creating a data model) and apply formulas. Using PowerPivot you create a structured model for your data in Excel. And it is fast. (Did I already mention it can handle lots of data?).
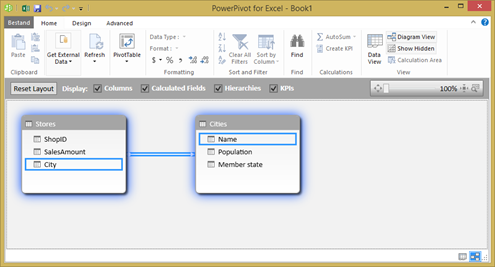
Continuing on from the example I started above, I added an Excel sheet with stores per city and their sales to the data model (the Excel sheet has just one sheet, which contains a simple table listing StoreID, SalesAmount and City). Then I related the two tables by dragging City from my Excel sheet to the Name column of the Wikipedia data I loaded using Power Query. The resulting data model is shown here:
Now I can do interesting stuff, such as add a calculation to figure out sales per inhabitant (Sales per Capita), by adding a column to the Stores tables with the following formula: =[SalesAmount]/RELATED(Cities[Population]) . (Dividing SalesAmount by the related cities’ population).
Reporting – Power View
Ah yes, Power View. The tool that is so easy to use that even my mom can use it (and its true). Power View enables you to create great looking, interactive reports with just a few mouse clicks right there in Excel. Just select what you need, decide how to show it and you’re done. Power View includes all the standard things: tables, matrixes, column charts, bar charts, pie charts. It also includes some great features that introduce time as a factor in your analysis by allowing you to create scatter plots with a play axis (think bouncing bubbles). Moreover, Power View can display images right there in your report and includes 2D mapping functionality.
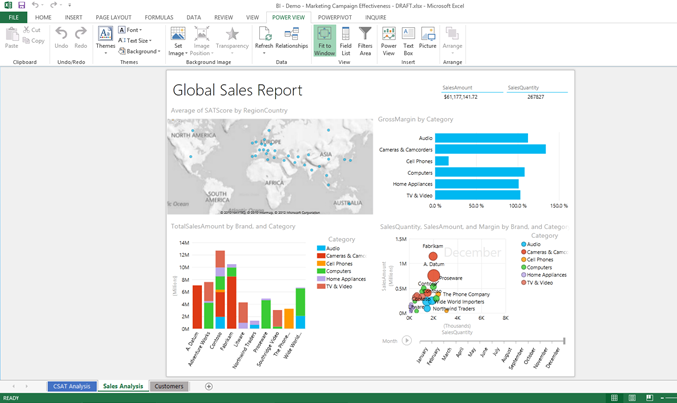
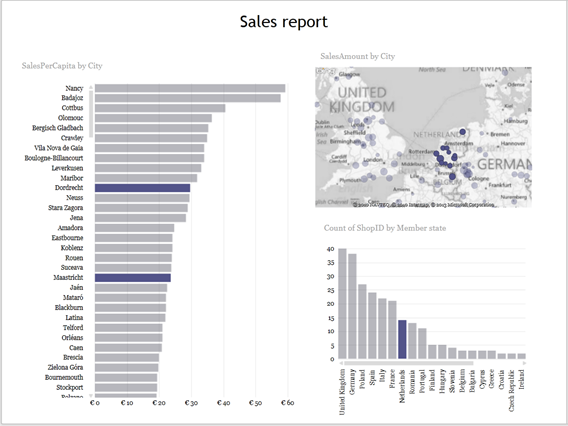
In my example, with just a few clicks I created this report (I selected the Netherlands as country in the bottom right graph to show the highlighting capabilities in the other graphs). Also note the texts above each item to understand what is displayed here.
Geospatial – Power Map
Power Map (previously known as GeoFlow) is a very powerful 3D mapping tool. It allows you to plot any data on a map, as long as it makes sense. For example, just trying to plot your products on a map might not make sense. However, plotting your stores on a map makes a lot of sense. You do not need to specify longitude and latitude or other fancy stuff. Just some text is enough and the tool will go out and try to plot it on a map. Just try it, enter some city or venue names in Excel and click Insert à Map. Two more clicks and you have plotted the information on a map!
In my example, here is what I created using Power Map. Again, this took me just two minutes:
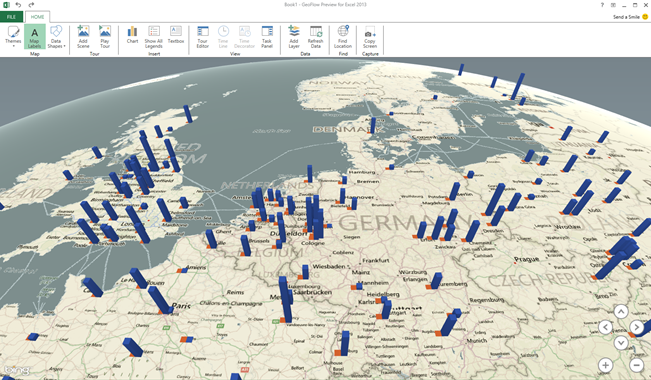
(Above shows total sales amount and sales per capita per city, plotted on the 3D map).
BI Sites
A BI site is an optimized workspace dedicated to BI. You might call this a data marketplace: it is a one-stop shop where you go to get anything related to BI. You go there to consume a report, create a new analysis, share an analysis, discover some new insights using the items provided and find information.
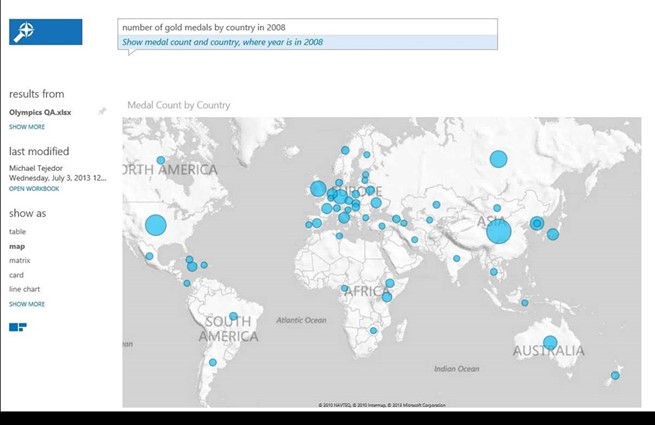
Natural language query – Q&A
This is a feature I particularly love! It gets us closer to Minority report: just type what you’re looking for and we’ll find it and display it. Once information is published to the BI Site (for example through the Data Management Gateway (below) but also just by uploading an Excel sheet), you can search through all that information just by typing a question. In my example this might look like ‘sum of sales amount by country’. You can change the way the information is displayed by including ‘as map’ or ‘as bar chart’ to your question. I do not have a demo available right now, so I’ll just include a screenshot here. Here the user just typed ‘number of gold medals by country in 2008’ and the information is retrieved from an Excel sheet (note that the user has not explicitly asked to get data from that particular sheet) and shows it as a map (since we know this is geospatial information).
Manage and monitor
Power BI empowers data stewards; business users can grant access to published data sets based and track who is accessing the data and how often. This brings to mind the PowerPivot management dashboard we know and love.
Data Management Gateway
The data management gateway allows IT to build connections to internal data sources (think your data warehouse or other LOB information source) so reports that are published to BI sites can get that data easily.
Mobile Access
Last but not least: mobile access (woohoo!). Users can access their reports through a HTML5 enabled browser or through a mobile application on Windows or iPad. This means that Silverlight is no longer a requirement for accessing Power View reports. Other platforms might be added later.
And this is relevant…how?
So you have read this and maybe read some other blogs as well. You’re thinking to yourself: why should I care?
My question then is: do you use Excel? Well yes, any person who has ever worked with a PC has used Excel.
Exactly. That’s why you should care. You should care because the good old Excel which you though you knew so well has suddenly transformed into a cool kid on the block with lots of great and really easy to use features.
Those features enable you to find any data, work your magic and then gain insight from that data. Just think about that. How could you use this in your business? And in your personal life? (I myself am looking to buy a house. Power BI has allowed me to understand which neighborhoods I would like to live and which not, just by finding and visualizing data). I know there are specialized, paid, services for that (involves sending a text and paying for the info). I did it myself in half an hour, paid zero and learned a lot more about the question at hand.
Try out connecting to Facebook for example, and plot your friends on a map! Or find out who has not disclosed their gender to Facebook… J
This might be a revolution: Power BI brings the might of information analysis tools to anyone to consume any data for any scenario. The possibilities are endless. It is just a matter of using your creativity.
Since you are human, using your creativity is probably what you really want to do. Power BI: be creative with data.
02 Jul 2013
This is the second post in my series about making SSRS report multilingual. You just missed the first post, the introduction and comparison of the solution scenarios.
This solution consists of an assembly registered in each report that should support multiple languages / localization. The assembly retrieves translation from a source, such as a data source, resource file, web service or online translation service. Anything is possible here.
This solution is limited in the fact that it will not translate dataset results nor parameter prompts. In addition there is an impact on the report creation process as you will see down the line. The upsides are that it is a relatively straightforward solution that has only little impact on report rendering performance.
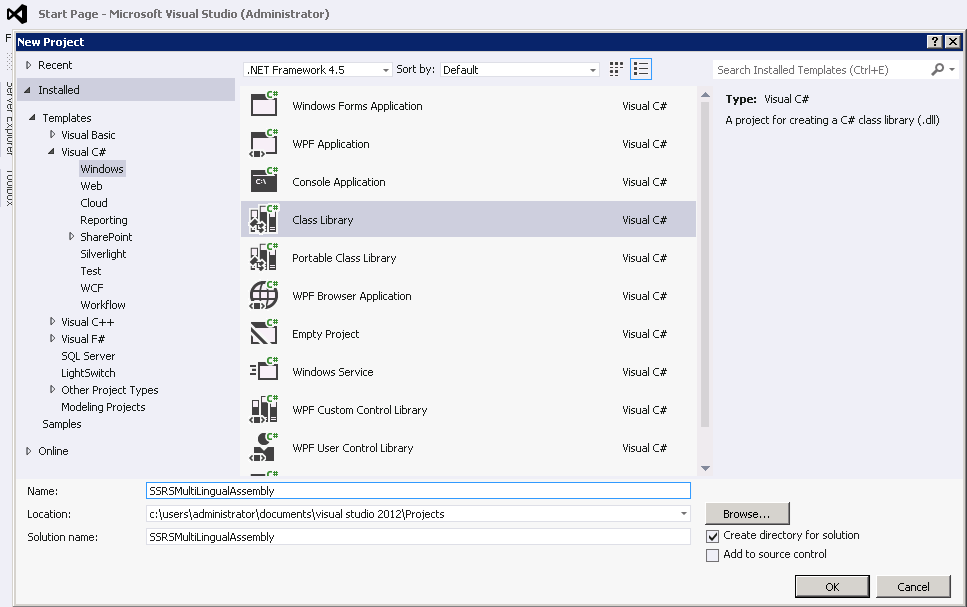
1. Creating the assembly
To implement this solution we first need the assembly that will do the actual translation / localization. To build this assembly fire up Visual Studio and create a new Class library project. I will use C# here (and in all my samples on this blog, but another language would work just as well). I named the project SSRSMultiLingualAssembly.
When the new solution and project has been created, rename Class1 to something that makes more sense. I renamed it to SSRSMultiLingual. 
Open the class and add the following method to it:
public string Translate(String cultureInfo, String item)
        {
            //Put logic here
            //return the translated string
            return "PLACEHOLDER: " + item +" translated into "+ cultureInfo;
        }
What you would need to do is implement the class and translate the item using the cultureInfo and return the translated result. This is very dependent on your actual situation and also fairly independent on the actual scenario you choose to implement.
For now, let’s continue to the SSRS side of things to tie things together. Later we can deal with actually making it do something.
After you have added the code, build the solution and make sure there are no errors.
2. Copy assembly to the SSRS folders
To make the assembly you have just built assessable from reports, you will need to copy it over to the SSRS directories, including any resource files or whatever your assembly needs to work. Of course you could make this part of a custom build action and kind of automate this action, but for now here is the manual method.
Copy the assembly into the Report Server path: C:\Program Files\Microsoft SQL Server\MSRS11.MSSQLSERVER\Reporting Services\ReportServer\bin
(this path may change based on installation location and version of SQL you have installed). This will register the assembly with the report server, which is strictly only required after deployment of the reports to the server and not during design / development time.
In order to make it accessible during design time, the assembly also needs to be copied to the report designer folder. Copy and paste the assembly to C:\Program Files (x86)\Microsoft Visual Studio 10.0\Common7\IDE\PrivateAssemblies (again, this path may change based on installation location and version of SQL / Visual Studio you are working with). Note the (x86) in C:\Program Files (x86), since the same directory also exists in C:\Program Files if you are working on a x64 system (which I assume you are).
By the way, if you use reporting services in native mode (i.e. not integrated with SharePoint) you also might have to copy the same assembly to C:\Program Files\Microsoft SQL Server\MSRS11.MSSQLSERVER\Reporting Services\ReportManager\bin. I have not tried this since I am running SSRS in SharePoint integrated mode.
Note that you could also add the assembly to the global assembly cache (GAC).
3. Add the assembly to your reports
In order for your reports to successfully use the assembly to translate text open a report in Report Designer (your Visual Studio environment).
From the report menu select report properties. In the dialog box click references.
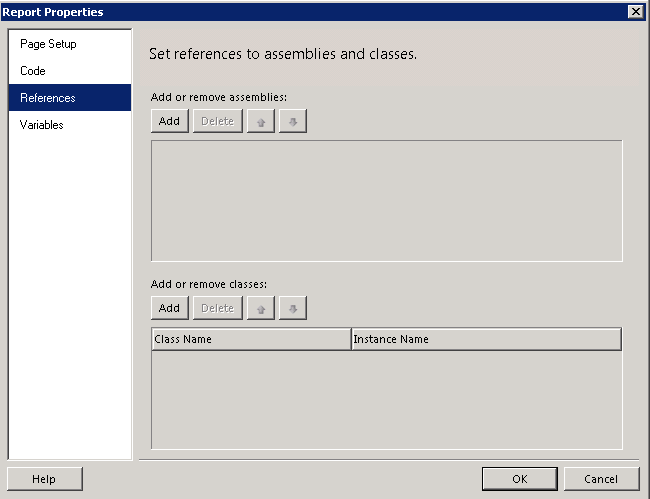
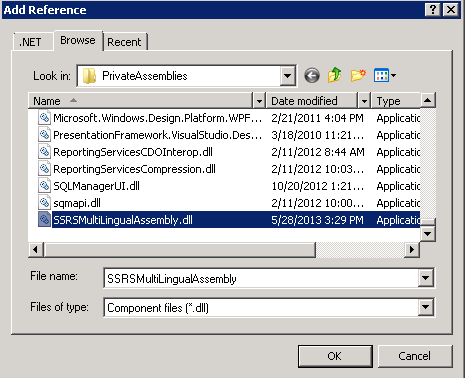
Click add and then click on the ellipsis button (…) at the end of the newly added row. In the next dialog box (add reference) click browse, locate the assembly and click ok.
Verify that your assembly has been added. In the bottom part of the dialog enter your class name (assemblyname.classname) and set up an instance name. Note that the class name is case sensitive. Your instance name can be anything, I chose to set my instance name to ‘myML’.
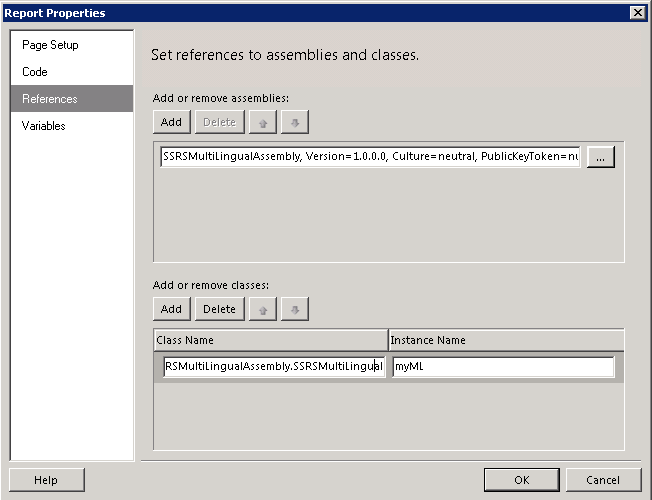
Close the dialog by clicking ok.
Now that we have added the custom assembly to the report it is time to call the translate function to translate text!
4. Calling the Translate function
Now that the report has a reference to the custom assembly, let’s wire up the last part to actually translate text. Start by either adding a textbox to your report or selecting a textbox (or any other label for that matter). Right-click the textbox and select expression… (Expressions allow you to do some limited programming that gets executed when the report renders). In the expression dialog box, enter the following code:
=Code.<your instance name>.Translate(user.Language,"<your text to translate>")
For example, with the settings I made the expression dialog box looks like this:
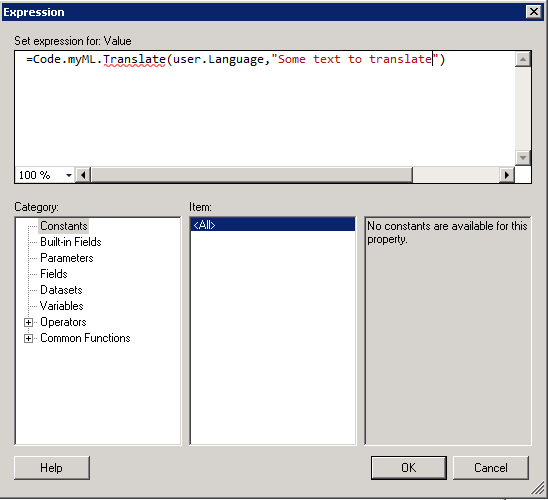
Click ok to close this dialog. Never mind the red squiggly line.
Now, the big moment is there! In report designer click preview and see the results of your labor!
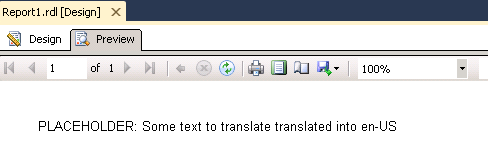
Come on, pat yourself on your back, you have successfully registered a custom assembly and used it in a report. That wasn’t too hard now was it?
Note that you will have to set up this expression with the correct parameter value for every single text on the report that you want to translate. This is very laborious and error prone. Also, this is the reason why this solution does not translate parameters.
5. Change Reporting Services configuration and deploy report
Once you have completed the report and am certain it works OK it is time to deploy the report to the report server. For the assembly to work there you will need to have the assembly in the appropriate places (see above) make some configuration changes and you will have to restart your Report Server after any change in the assembly, including first registration.
If you do not make the required configuration changes you will get the following error when deploying:
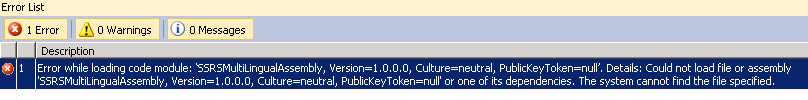
Assuming you have already copied the assembly to the correct directories as indicated above, let’s make the required configuration changes. You will have to open the rssvPolicy.config file located in C:\Program Files\Microsoft SQL Server\MSRS11.MSSQLSERVER\Reporting Services\ReportServer. Open the file and find the <CodeGroup> tags. There will be a bunch of them. Basically what we need to do is add one of our own after the last <CodeGroup> tag. This is what you will have to add:
<IMembershipCondition Version="1" Url="C:\Program Files\Microsoft SQL Server\MSRS11.MSSQLSERVER\Reporting Services\ReportServer\bin\SSRSMultiLingualAssembly.dll" />
Change the Url value to match your situation. This code group gives the assembly (your assembly in the directory specified above (which you will have to change based on your installation) full trust permissions. For testing purposes you could get rid of the SSRSMultiLingualAssembly.dll part and give any assembly in the directory full trust, however in production you will have to set up the code group as specific as above, so why not do it right from the start?
Now it is time to restart the Reporting Services service. To do this either use services.msc or use SQL Configuration Manager.
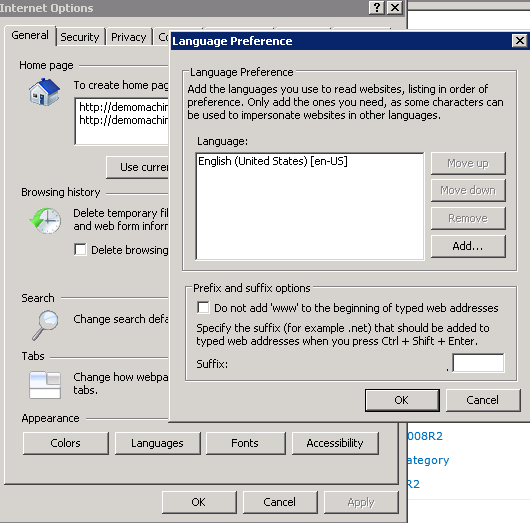
Now, deploy the report and render the report. You can test different languages by switching your Internet Explorer to another language (Settings à Internet Options à Languages).
Rejoice! You have successfully implemented this scenario of localization of SSRS reports. It may be time to check out the other implementation scenarios.
 Dutch Data Dude