Analyzing Amsterdam Crime Rates with Power BI
22 Apr 2014Here is another example of what can be done with Power BI. This time I attempted to analyze crime rates in Amsterdam.
I retrieved burglary and burglary attempts figures from the Dutch Police website: http://www.politie.nl/misdaad-in-kaart/lijst?geoquery=amsterdam&categorie=1&categorie=2&pageSize=500&page=1
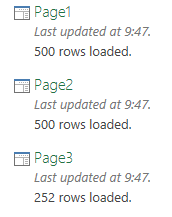
There are three pages here, so I use Power Query to get all three pages into Excel and then appended them together in one big table. I did this using three ‘from web’ commands in Power Query, so I got the following queries:

Next step was to append the three tables together. I started with the ‘append’ command in Power Query which allowed me to append Page1 and Page 2 together. A quick edit of the code gave me the result I was looking for:
let
 Source = Table.Combine({Page1,Page2}),
 Source2 = Table.Combine({Source,Page3})
in Source2
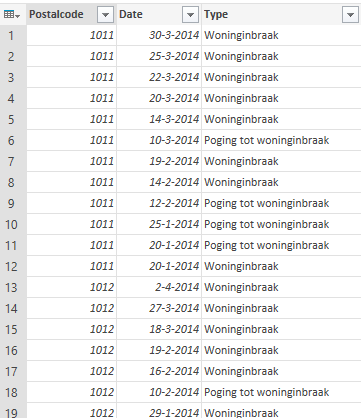
And the resulting table:

Next, I loaded the table to PowerPivot, added a quick sum and then opened Power Map by going to InsertàMap in Excel.
In Power Map I created three layers, one using shapes, another one using a heat map and a third using a column graph. Then I created a tour using these layers. The resulting video is below.
As you can see, it is really easy to visualize geographical data using Power BI in Excel! Pretty cool huh?
 Dutch Data Dude